NexPort Analytics
Login to Nexport AnalyticsDocumentation
  • NexPort Analytics
  • Getting Started
    • What's New in Analytics
      • Analytics 2.3.3 Released
      • Analytics 2.3.2 Released
    • Access Analytics
    • System Requirements
    • Change Time Zone
    • Use the Report Paging Toolbar
  • Quick Start
    • Create Custom Reports
    • Schedule Reports
    • View Previously Saved Reports
    • Create Dashboards
    • Add Widgets
    • Share Dashboards
  • Reference
    • Create Custom Reports
      • Types of Reports
        • Subscriptions Report
        • Section Enrollments Report
        • Training Plan Enrollments Report
        • Assignment Statuses Report
        • Transcript Records Report
        • Sections Report
        • Training Plans Report
      • Types of Filters
        • Yes/No Filter
        • Date Filter
        • Text Filter
        • Numeric Filter
        • Time Filter
        • Group Filter
        • User Filter
        • Section Filter
        • Training Plan Filter
        • Time Zone Filter
        • Phase Filter
        • Result Filter
        • Transcript Record Status Filter
        • Grading Strategy Filter
        • Assignment Type Filter
        • Transcript Record Type Filter
        • Custom Field Filter
        • Date Range Pre-Filter
      • Build a Custom Report
        • Manage Report Type
        • Manage Organization Filters
        • Change Report Mode
        • Reset Custom Report Settings
        • Load a Custom Report
        • Grouped By Column or Filter (Aggregate Report Mode only)
        • Functions (Aggregate Report Mode only)
        • Manage Columns (Flat Report Mode only)
        • Manage Filters (All Report Modes)
          • Add Filter to a Custom Report
          • Remove Filter from a Custom Report
          • Add OR Condition to Filter
          • Remove OR condition from Filter
        • Save a Custom Report
        • Download a Custom Report
    • Schedule a Custom Report
      • Create a Schedule for a Custom Report
      • Modify Custom Report Schedule
      • Download Archived Report
      • Run a Test Schedule
      • Delete a Schedule
    • View Saved Reports
      • Rename a Report
      • Add Schedule to a Report
      • View the Schedule list for a Report
      • Delete a Report
    • Manage Dashboards
      • Analytics Dashboard Features
      • Dashboard Management
        • View and Search Dashboard listing
        • Create a Dashboard
        • Modify Dashboard details
        • Remove a Dashboard
        • View Audit Logs of an Organization
      • Dashboard Widget Management
        • Widget Management Icons
        • Widget Types
        • View and Search Widget in List Display
        • Add a Widget
          • Add a Custom Report Widget
          • Add a Line Chart Widget
          • Add a Bar Chart Widget
          • Add a Radar Chart Widget
          • Add a Pie Chart Widget
          • Add a Doughnut Chart Widget
          • Add a Polar Chart Widget
          • Add a Pivot Table Widget
        • Manage Dashboard Access
          • Permit or Revoke a User
            • View and Search Permitted Users Listing
            • View and Search all Users Listing
          • Restrict Data for Permitted User
            • View and Search Restricted Groups Listing
            • View and Search all Groups Listing
        • View Audit Logs for a specific Dashboard
        • Modify a Widget details
        • Remove a Widget
  • faqs
    • Common questions
    • Dashboard related questions
    • Custom report related questions
    • Schedule custom report related questions
  • Glossary
    • Glossary
Powered by GitBook
On this page
  1. Reference
  2. Manage Dashboards
  3. Dashboard Widget Management
  4. Add a Widget

Add a Pivot Table Widget

You can personalize and customize the pivot table appearance.

PreviousAdd a Polar Chart WidgetNextManage Dashboard Access

Last updated 2 years ago

To add a pivot table widget

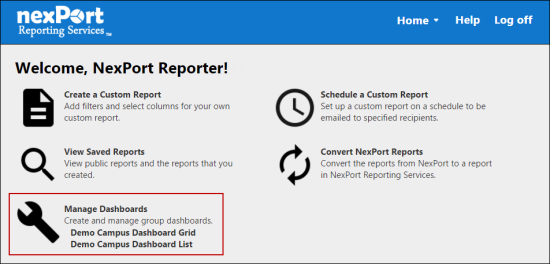
Step 1: On the Analytics homepage, click Manage Dashboards.

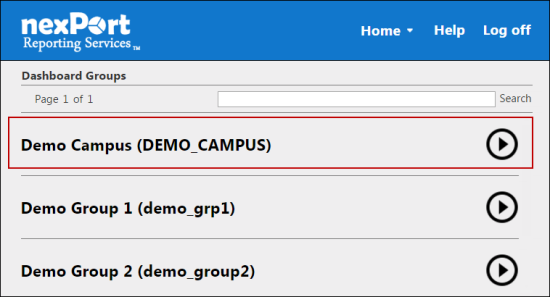
The Dashboards Groups page is displayed.

Step 2: Select a group to view its dashboards.

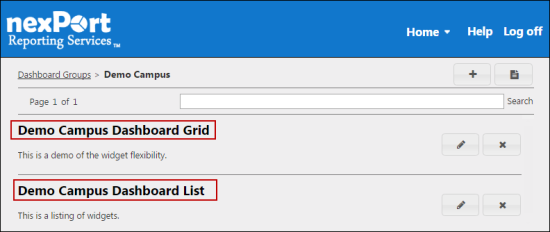
A dashboard list for the selected group is displayed.

Step 3: Select a dashboard (Grid view or List view) to which you need to add a pivot table.

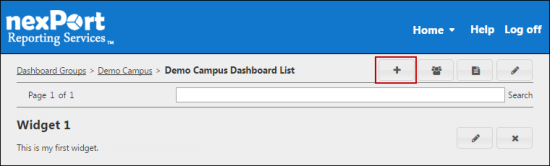
The <DashboardName> page is displayed.

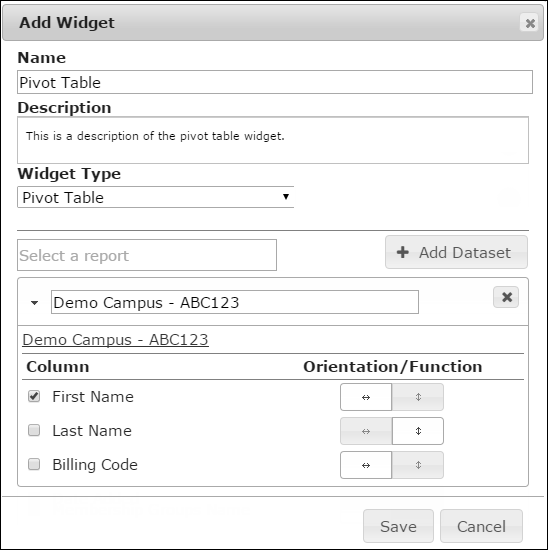
The Add Widget dialog box is displayed.

Step 5: In the Name box, type a name for the widget.

The widget name appears on the widget title bar.

Step 6: In the Description box, type a brief description of the widget.

Step 7: In the Widget Type list, select Pivot Table.

Step 8: In the box, search for a report, and then select a report.

All reports in your organization or its descendants appear in the box. Parent organization filters appear for subgroup as well. In a widget you can select reports that are public or the reports that you have authored.

A warning sign next to the report title indicates that the report contains organization filters that do not allow dashboard access. The data for those organizations are not displayed on the dashboard.

Step 9: Click Add Dataset.

In a pivot table, you can have only one dataset per widget.

Step 11: In the Column section, select the X-axis and Y-axis for the pivot table.

You must select at least one X-axis. If there is no Y-axis available or you do not select a Y-axis, by default the pivot table displays the count of grouped X-axis values.

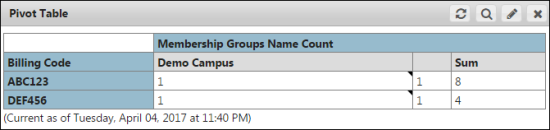
Step 13: Click Save.

The pivot table widget is saved and appears on your dashboard.

© NexPort Solutions. All Rights Reserved.

Step 4: In the upper-right corner, click the icon.

Step 10: Click the icon if you need to remove the dataset.

Step 12: Click the icon to display the data in a horizontal line as a table row. Click the icon to display the data in a vertical line to make it the pivot column.